
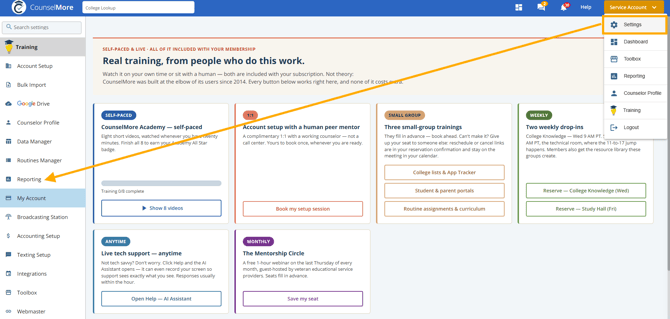
Below, we explain the available reporting tabs and their functions.

1. Counselor Comparison
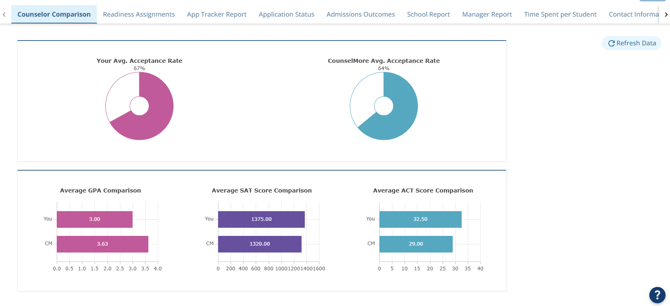
This tab allows for a side-by-side performance comparison. Metrics include:
• Your Average Acceptance Rate: The acceptance rate for students under you.
• CounselMore Average Acceptance Rate: A benchmark comparing all counselors using the platform.
• Average GPA Comparison: A comparison of the average GPA of students across counselors.
• Average SAT Score Comparison: Average SAT scores per counselor.
• Average ACT Score Comparison: Average ACT scores per counselor.
2. Readiness Assignments
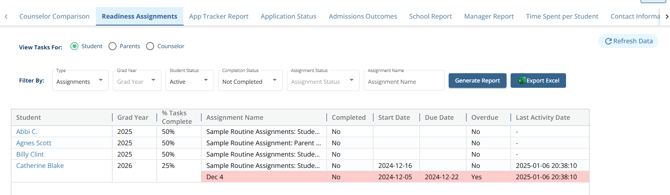 • Run custom reports and view tasks assigned to students, parents, or counselors.
• Filter Options: Type, graduation year, student status, completion status, and assignment name.
• Export: Results can be exported to Excel for further analysis.
3. App Tracker Report
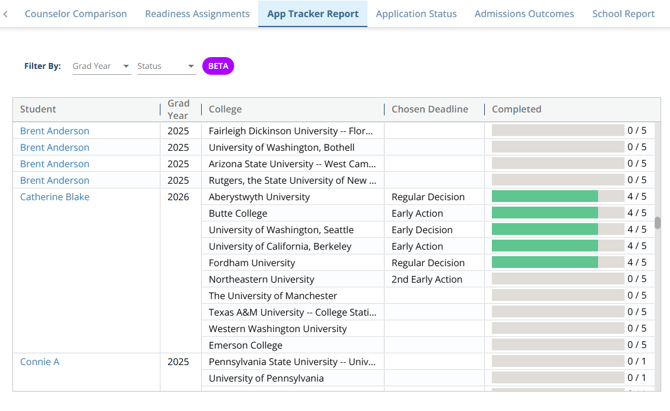
• Monitor application tracking progress.
• Filter Options: Graduation year and status.
4. Application Status
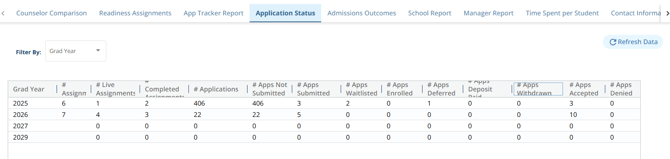
- Shows how many applications each graduation year has, and where they stand.
- Filter Options: Grad Year. Click Refresh Data to update the numbers.
- Columns: # Assignments, # Live Assignments, # Completed Assignments, # Applications, # Apps Not Submitted, # Apps Submitted, # Apps Waitlisted, # Apps Enrolled, # Apps Deferred, # Apps Deposit Paid, # Apps Withdraw, # Apps Accepted, # Apps Denied.
- Assignments, # Live Assignments, and # Completed Assignments count the assignments for students in that grad year: all assignments, the ones still active, and the ones marked complete.
- Applications is the number of schools on your students’ App Trackers. Each application counts as either Submitted or Not Submitted, so those two columns add up to # Applications.
- An application counts as submitted when Application Submitted is set to Yes in the App Tracker.
- The outcome columns (Accepted, Denied, Waitlisted, Enrolled, and so on) count submitted applications by result. One application can appear in more than one outcome column, for example Accepted and Enrolled.
Tip: To see which applications are still not submitted, go to Dashboard › App Tracker View and click Smart Sort.
5. Admissions Outcomes
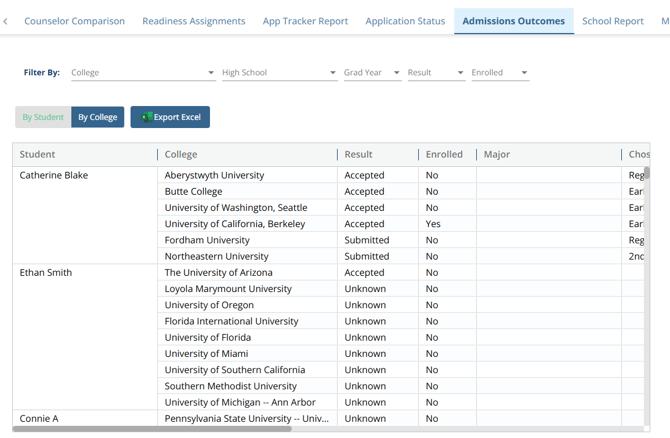 The Admissions Outcomes tab in the Reporting section allows counselors to review application results comprehensively, either by student or by college. This tab provides detailed columns such as student name, college, result, enrollment status, major, chosen deadline, award amount, application notes, graduation year, high school, GPA, WGPA, SAT (highest composite), and ACT (highest composite). Counselors can filter the results by various criteria, including college, high school, graduation year, result, and enrollment status. This powerful tool ensures you can easily track and analyze outcomes to better support your students' college application processes.
6. School Report
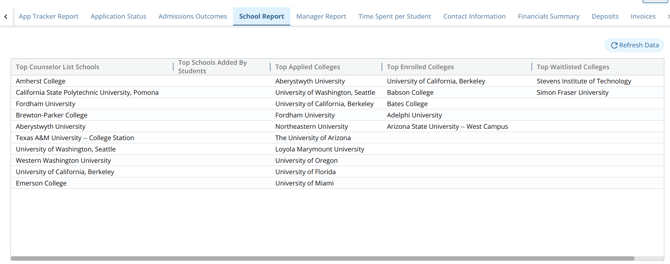 • Insights into:
◦ Top counselor list schools.
◦ Top schools added by students.
◦ Top applied colleges.
◦ Top enrolled colleges.
◦ Top waitlisted colleges.
7. Manager Report (For Admins of Multi-Counselor Accounts)
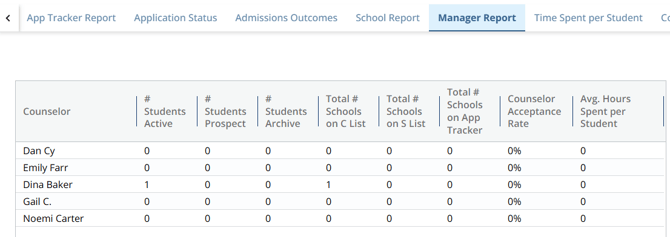 • Metrics include:
◦ Number of active, prospective, and archived students per counselor.
◦ Total schools on counselor and student lists.
◦ Total schools in the App Tracker.
◦ Counselor acceptance rates.
◦ Average hours spent per student.
8. Time Spent Per Student
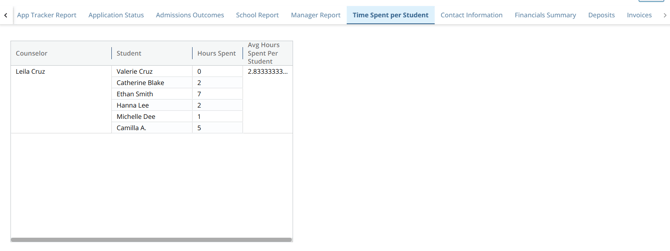 • Displays hours spent on each student and the average time spent per student.
9. Contact Information
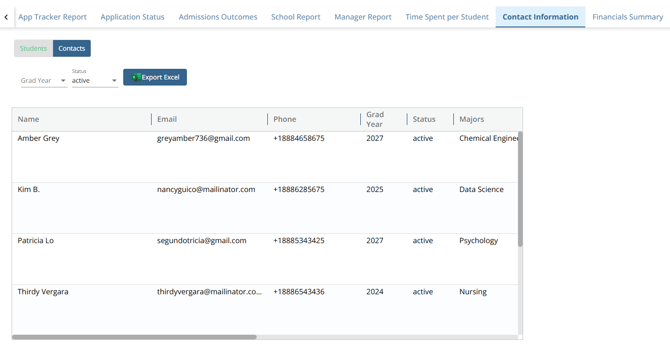 • View details by students or contacts.
• Filter Options: Graduation year and status.
• Export: Results can be exported.
10. Financials Summary
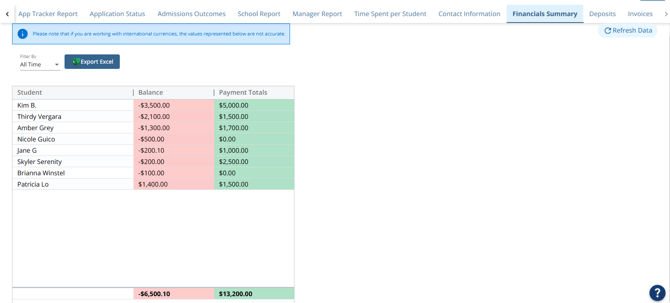 • Displays students, balances, and payment totals.
• Export: Results can be exported.
11. Deposits
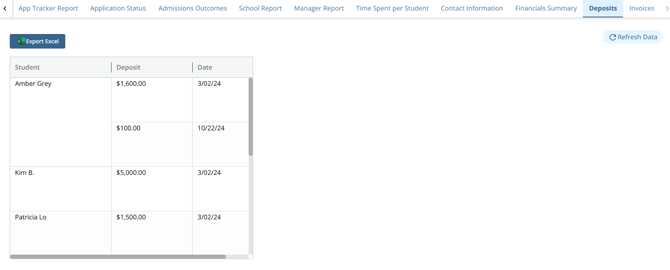 • Shows rows of students, deposit amounts, and dates.
• Export: Results can be exported.
12. Invoices
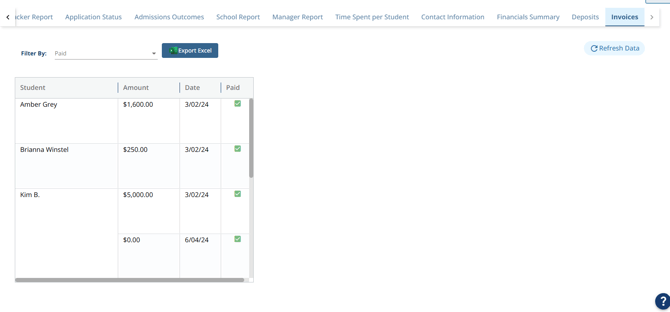
• Filter Options: Paid (All, Yes, or No).
• Displays columns for students, amounts, dates, and payment status.
• Export: Results can be exported.
Custom Reports
Have you created Custom Data Columns and you'd like those data columns to be available in your reporting?
Email support@counselMore.com
Tell us the Admin account login email address
Tell us the title of ALL OF THE COLUMNS, you'd like included in a report. Making a spreadsheet with the columns titles in the order you prefer - would be very helpful to our team knowing exactly what you are looking for.
We area always here to help!